Your Biggest Portfolio Risk Might Be Hidden.

Most investors know what they own—but not where their portfolio's risk actually comes from. SharpeShare reveals hidden concentration, risk contributors, and portfolio exposure so you can understand what is really driving your portfolio.

Your Biggest Portfolio Risk Might Be Hidden.

Most investors know what they own—but not where their portfolio's risk actually comes from.

SharpeShare reveals hidden concentration, risk contributors, and portfolio exposure so you can understand what is really driving your portfolio.

  • Reveal hidden concentration across your portfolio
  • See which holdings contribute the most portfolio risk
  • Visualize your portfolio with an interactive Risk Map
  • Spot potential weak points before the next market downturn

Free trial. No spreadsheets. No manual tracking.


Know Where Your Risk Comes From

SharpeShare reveals how each holding contributes to your portfolio's overall risk, helping you identify concentration, diversification, and the investments that matter most.

  • See your full risk picture in one interactive map
  • Pinpoint the holdings adding the most volatility
  • See how much diversification is actually protecting you
  • Catch dangerous concentration before it costs you

Portfolio Risk Map

Portfolio risk-return map

Bubble size: Portfolio weight Color: Sector

Illustrative portfolio risk map — not investment advice.


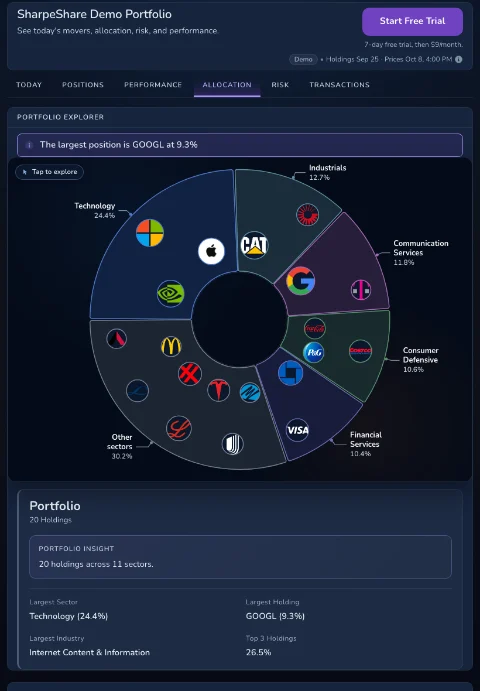
Portfolio Risk Isn't Evenly Distributed

Risk rarely comes from one number. It usually concentrates in a handful of sectors, industries, or holdings you might not expect.

Most investors check a single risk score and stop there. SharpeShare breaks your exposure down by sector, industry, and company, so you can see exactly what's really driving it.

Portfolio Explorer

Illustrative portfolio allocation — not investment advice.


Measure Risk Alongside Performance

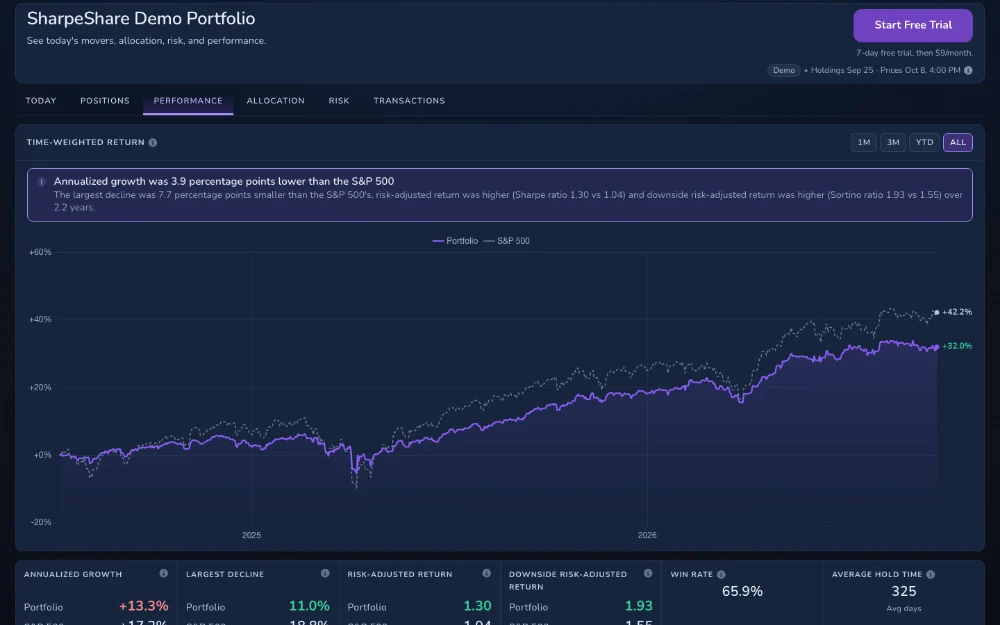
High returns aren't always better if they require taking substantially more risk. Compare your returns alongside benchmark performance and risk-adjusted metrics to understand whether the trade-off is worth it.

  • Benchmark your portfolio against the S&P 500
  • Measure performance with CAGR, Sharpe, Sortino & Max Drawdown
  • Track your investing performance over time
  • No spreadsheets or manual calculations

Portfolio Performance

Cumulative Return

CAGR
Portfolio
+13.4%
S&P 500
+16.1%
Max Drawdown
Portfolio
12.2%
S&P 500
18.8%
Sharpe Ratio
Portfolio
1.21
S&P 500
0.97
Sortino Ratio
Portfolio
1.79
S&P 500
1.43

Illustrative portfolio performance -- not investment advice.


Broker-Connected Risk Analysis

Connect your broker securely through Plaid so SharpeShare can uncover hidden portfolio risk using your real holdings. Your brokerage credentials are never stored.

  • Encrypted broker connection through Plaid.
  • Read-only access means SharpeShare cannot place trades or move funds.
  • Your portfolio stays private unless you choose to share it.

Connect securely through Plaid

Read-only connections. Your funds stay at your broker.


How It Works

Three steps. No spreadsheets.

1
Connect Your Broker

Securely link a supported brokerage account using Plaid.

2
Analyze Portfolio Risk

SharpeShare identifies hidden concentration, portfolio risk contributors, and overall exposure across your holdings.

3
Reduce Hidden Risk

Use risk attribution, concentration insights, and interactive visualizations to better understand where your portfolio is most vulnerable.


Reveal Your Portfolio's Hidden Risk

Connect your broker to uncover hidden concentration, visualize portfolio risk, and identify your biggest risk contributors.

No credit card required.